
Japanese candlestick patterns/charts are a common & very popular technical analysis tool for finding reversal of patterns and improving your trading techniques.
The candlestick chart will show you the current activity in the market, giving you an precise idea of what actions you need to take to profit in market.
When used for its intended purpose you’ll get great results in trading.
However, using candlestick charts/patterns in trading can be difficult. Especially when you don’t have any idea of how to read the charts perfectly. When you’re just starting to learn, all the patterns and definitions can be really confusing.
So let’s go and cover the basics
Forex , Stocks , Nasdaq , crypto , Equity , s&p 500 , s&p 100 , Nifty , Nifty50 , Sensex , nse , bse , bank nifty , nifty live , penny stocks , etf , investing , share markert , cryptocurrency , currency , commodity
Candlestick Chart
best forex trading website, best forex sites, top forex sites, forex trading, e trading platform what is forex trading, best trading strategy, learn to trade, day trading strategy, mutual fund
Candlestick patterns/charting is an old Japanese method of technical analysis.
Candlestick graphs not only display the absolute values of the open, high, low, and closing price for a given period. But they can also indicate current trend reversal very clearly if you know how to read them.
Whether that trend reversal will take place on the next day, next month or even in the next years to come, it’s essential you’re prepared for those reversals by reading the chart properly.
Candlesticks consist of a body made of a colored rectangle and two tails, one above and one below the candle.
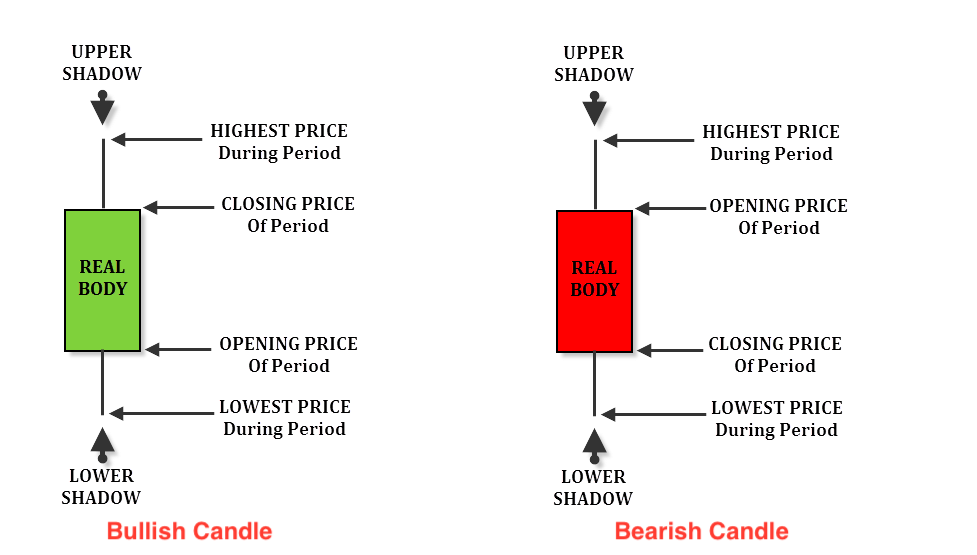
This is how you read candlestick charts.
The top point of the upper tail represents the highest traded price for that time period.
The lowest point of the lower tail represents the lowest traded price for that current time period.
The opening price is at the bottom of a green candlestick or at the top of a red candle. The closing price is at the top of a green candle or at the bottom of a red candle. The rectangular box is known as the body.
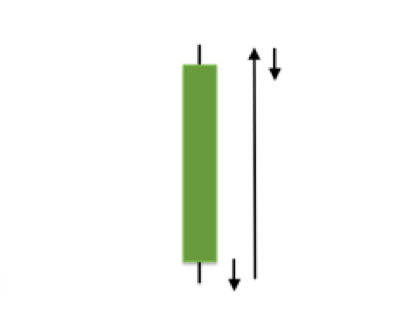
If the market, closes higher than the opening, the body is white or green, with the bottom of the rectangle representing opening price and top of the rectangle representing closing price.
This is a green bullish candlestick:
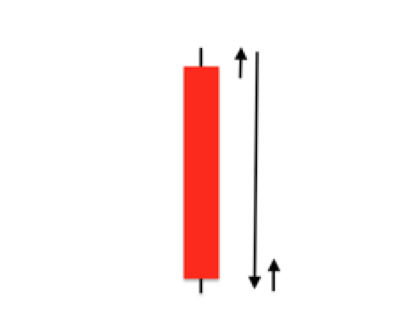
If the market closes lower than the opening price, the body is black or red, with the top of the rectangle representing opening price and bottom of the rectangle representing closing price.
This is a red bearish candlestick:
The full trading range for each session is represented by the upper and lower extensions from the real body. These are called the upper tail and lower tail also called shadow’s or wick’s.
An exceptionally long tail also shows failed momentum by buyers (long upper tail) or sellers (long lower tail), signal’s a potential reversal of the existing trend.
When the open and the close are at the extreme high or low of the price movement for that current time period, then there will not be any tails.
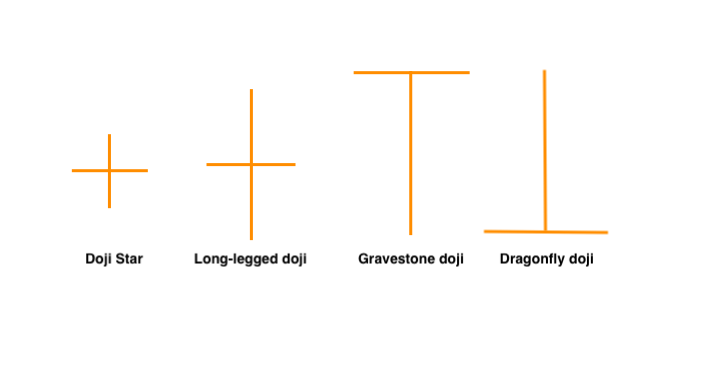
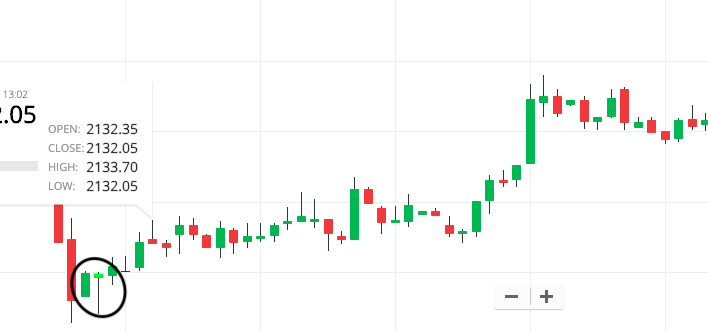
When the opening and closing price are identical or very close, the real body is replaced by a horizontal line, forming a doji candlestick.
The Doji is one of my favourite candles & can be traded as a simple candlestick pattern strategy.
Why Do Candlestick Trading Work
Candlestick trading work because they provide you exact information about each trading period in a visual format that is very easy to understand, allowing you to compare the behavior of price action in different time period’s with a quick glance at your trading chart’s.
You can view candlestick pattern/charts on all popular technical analysis softwares.
Each candlestick can be read as a meaningful part of predicting the next price move and market behaviour at a time.
So are candlestick charts better than bar charts and line charts, maybe yes.
In the charts below, you can see the visual advantages candlestick charts have compared to the line and bar chart’s.
One of the most powerful visual attributes of candlestick pattern/charting is the ability to immediately see the overall price action.
While line charts and bar charts reveal direction but not so much about current time period, the candlestick short-term trend is easily spotted by analysis of each candle.
Simple Way To Read Candlestick charts/patterns
A simple way on how to read a candlestick pattern/chart is to look at the size of the candle body and the length and position of the tail’s.
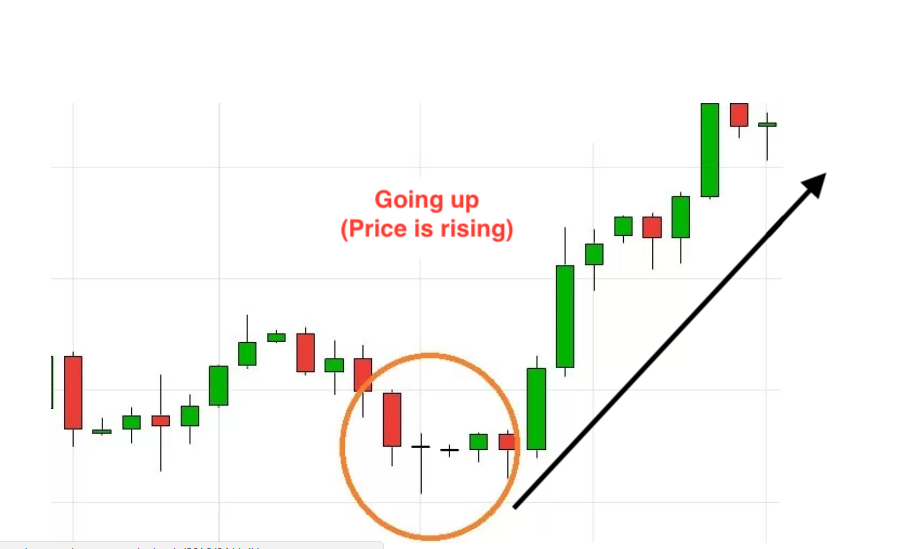
If price action show you long bullish candles with no lower tails you can assume the bullish trend is strong at a time.
With candles, you can spot trends more quickly by looking if the candles. If price action show you long bearish candles with no upper tails you can assume the bearish trend is strong at a time.
Candlestick Charting Techniques & Patterns
Most important, candles are vital for spotting reversals; these reversals are usually short-term, and sometimes long-term.
When traditional technical analysis talks about reversals, they are referring
to formations that occur over long periods of time.
Pay more attention to them, they often warn you of trend changes.
Candlestick Patterns Explained With Examples
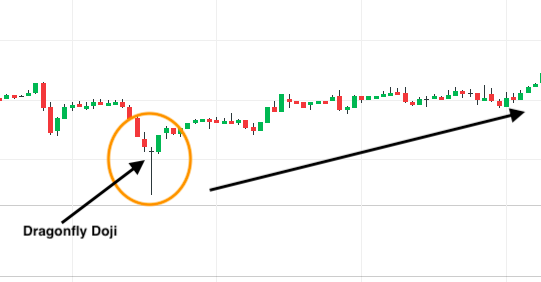
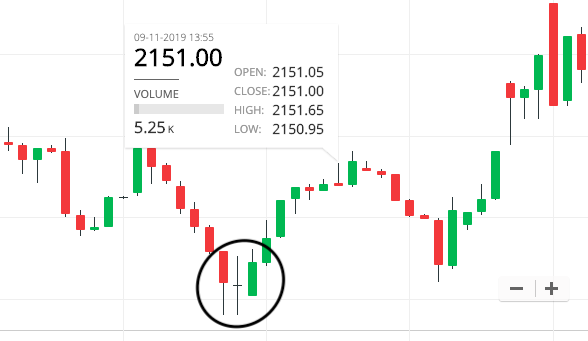
Doji Reversal Candlestick (Bullish Chart Pattern)
Hammer Reversal Candlestick (Bullish Chart Pattern)
In this you can see the hammer candlestick that is one of our favorites patterns, closing price is higher than the opening price for that time period. The upper tail is small and the lower tail is twice the length of the body of candle.
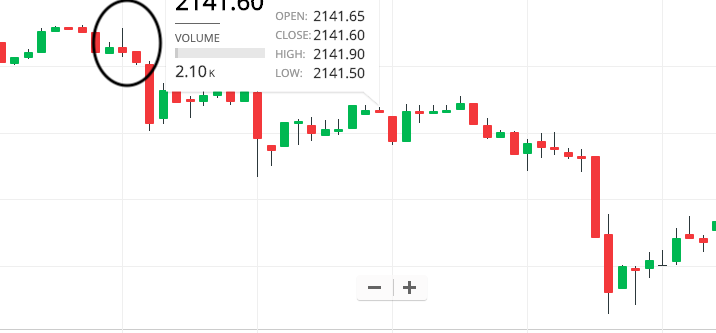
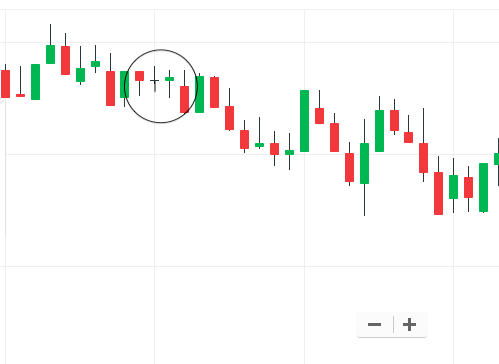
Spinning Top Reversal Candlestick (Bearish Chart Pattern)
Doji Candle Reversal (Bullish Chart Pattern)
Doji Reversal / Evening Star Candlestick (Bearish Chart Pattern)
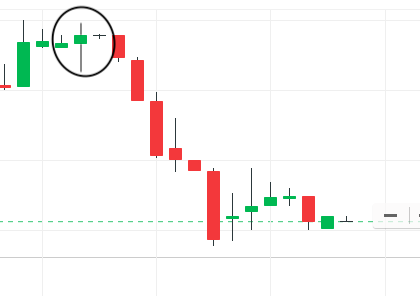
Hanging Man Candlestick (Bearish Chart Pattern)
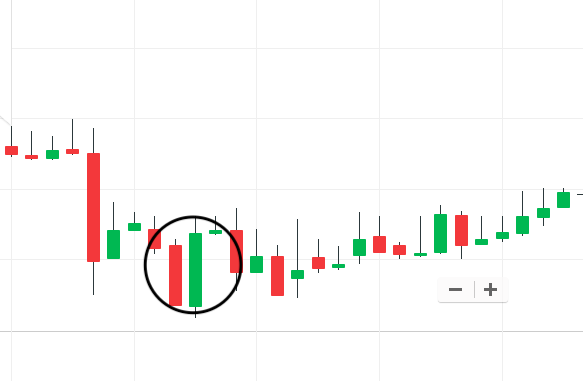
Bullish Engulfing Candlestick Pattern (Bullish Chart Pattern)
The engulfing candlestick pattern is a very reliable pattern. Explained by the opening price for that time period is below or at previous time period’s close and the closing price is above the previous time period’s open. Green or white candle body with very short upper and lower tails engulf the red or black/green candle.
In a same manner Bearish Engulfing Candlestick Pattern works
Candles offers so many unique benefits that it’s honestly a bad move if you don’t use this charting technique.
sailormoon xxx
5 Mar 2021I simply wanted to construct a message so as to thank you for some of the stunning hints you are giving at this site. My time intensive internet search has now been rewarded with reasonable ideas to write about with my family. I would say that most of us visitors are very lucky to be in a wonderful community with very many lovely people with good tricks. I feel very much happy to have seen your entire weblog and look forward to so many more enjoyable minutes reading here. Thanks again for all the details. Prudi Raviv Howie
Stockspro24
25 Jul 2022Thanks For your Valuable comment :))
bahis oyna
28 May 2022Very good blog article. Really thank you! Fantastic. Francesco Seda
Stockspro24
25 Jul 2022Thanks For your Valuable comment :))
bahis oyna
23 Jun 2022Im thankful for the post. Much thanks again. Awesome. Isidro Stuer
Stockspro24
25 Jul 2022Thanks For your Valuable comment :))
kacak bahis siteleri
9 Jul 2022Very good post. I will be going through a few of these issues as well.. Troy Hikes
Stockspro24
25 Jul 2022Thanks For your Valuable comment :))
sikis izle
11 Jul 2022Major thanks for the blog post. Much thanks again. Fantastic. Cruz Myles
Stockspro24
25 Jul 2022Thanks For your Valuable comment :))